The effect of the drainage conditions on the shear process was examined on A-type specimens through torsional shear tests. The experimental results of shear deformation and failure properties are shown and discussed in this section.
Shear Properties
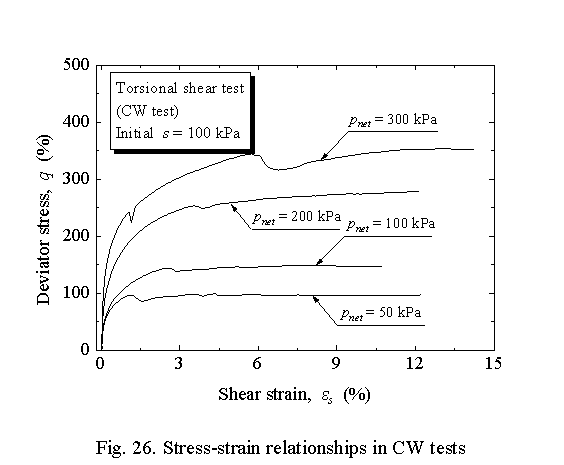
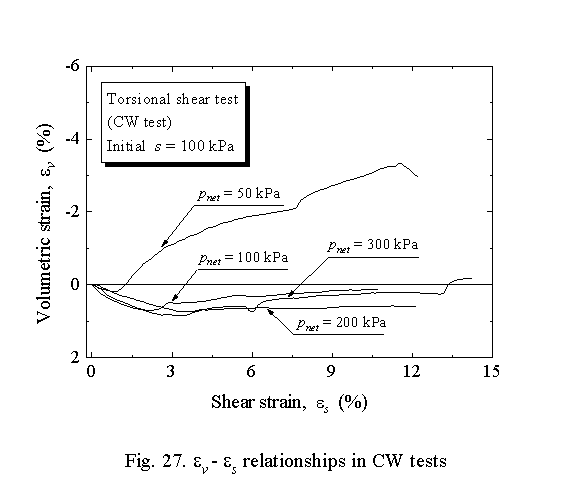
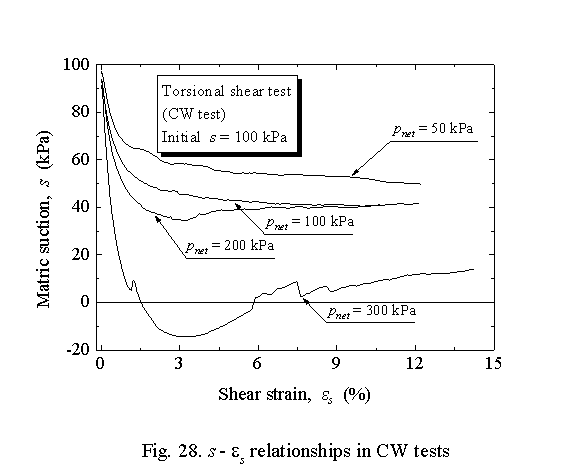
Figures 26, 27 and 28 show the stress-strain, εv - εs and s - εs relationships in constant water content tests, respectively. Looking at the stress-strain relationships, there are small peaks and it seems that the ultimate (residual) state is reached at larger strain. The peak appears at a smaller εs when pnet is smaller. Volume change shows a contractive behaviour except for the case of pnet = 50kPa. Matric suction decreases significantly in the initial stage of shear, which is similar to that observed in triaxial compression tests.
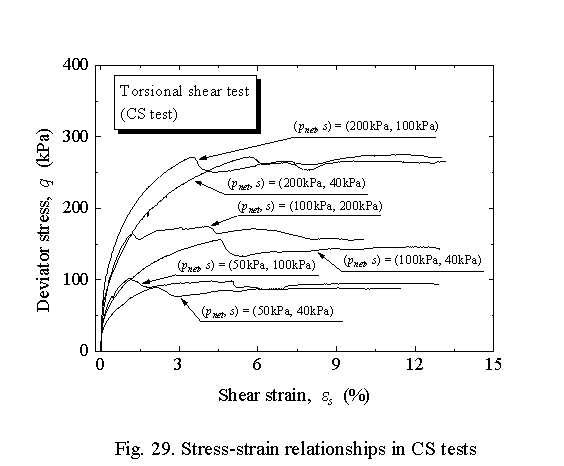
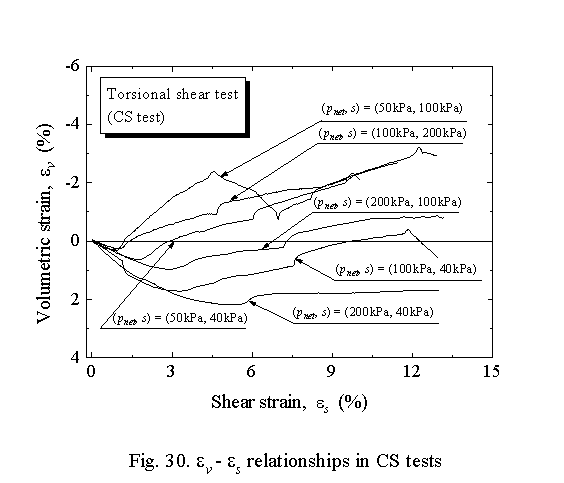
Figures 29 and 30 shows the stress-strain and εv - εs relationships in consolidated drained (constant suction) tests, respectively. Small peaks also appear and the ultimate (residual) strength is approximately equal for the same pnet. The stress-strain and εv - εs relationships show that the peak in stress-strain relationship tends to appear at smaller εs and that the dilation occurs at smaller pnet and larger s. There is a variation in the volume change behaviour for the case of pnet = 50kPa and s = 100kPa because of local failure, which means that the appearance of a shear band occurs in the specimen.
Final State
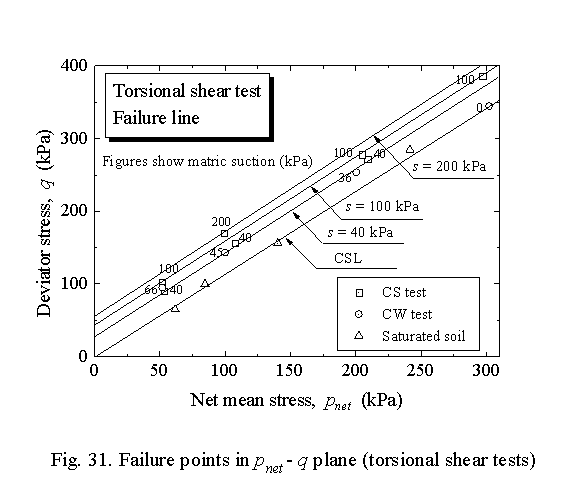
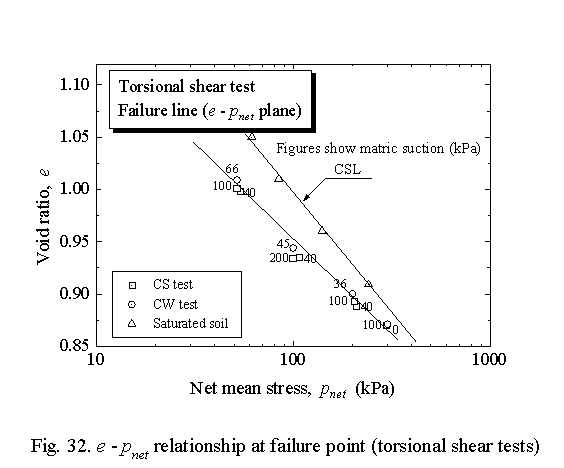
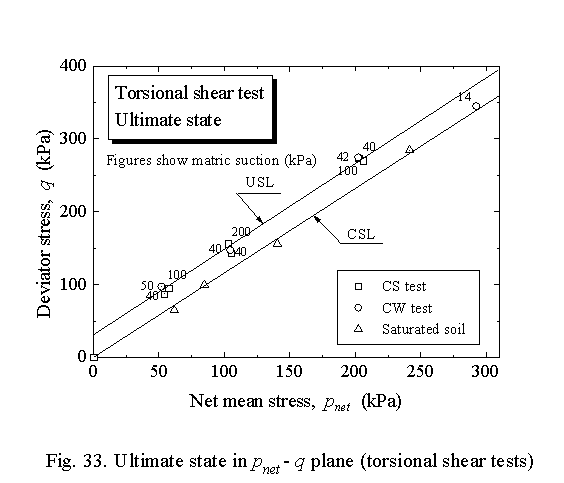
The relationship between pnet and q corresponding to the maximum strength is shown in Fig. 31. The failure line at constant matric suction is parallel to the CSL of a saturated soil and plots higher for a larger matric suction. This means that any increment in strength due to matric suction is constant and independent of pnet. Figure 32 shows the e - pnet relationship at maximum strength. The failure line of unsaturated soil is below the CSL and is not affected by matric suction. Moreover, the pnet - q relationship at the ultimate (residual) state is shown as USL (ultimate state line) in Fig. 33. It can be seen that the effect of matric suction does not appear, unlike in the case of the maximum strength state. This line (USL) is a little below the failure line at s = 40kPa. This is a boundary, which distinguishes strain softening and hardening of the stress-strain curve.
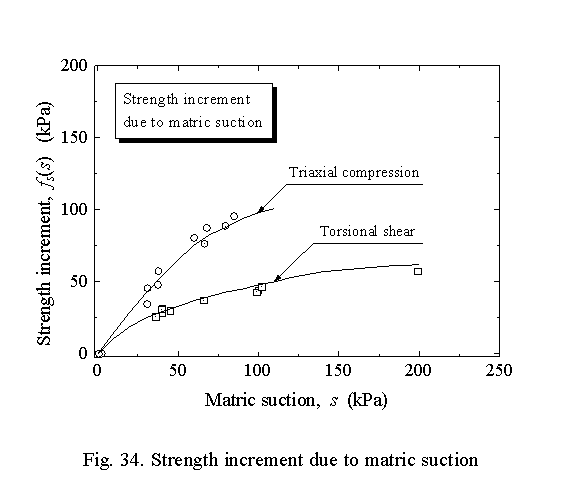
Figure 34 shows the relation between strength increment fs(s) due to matric suction and matric suction s. The value of fs(s) is calculated from q at a certain s minus q of saturated soil, and this corresponds to the intercept of the failure line at a certain suction in the q and pnet relationship. Figure 34 shows that there is a non-linear relationship between fs(s) and s. Furthermore, it is considered that there is some effect of the stress state on fs(s) because there is a large difference between the fs(s) of the triaxial compression test (α = 0o and b = 0) and that of torsional shear test (α = 45o and b = 0.5). However, more experimental data with controlled α and b are necessary to demonstrate and prove the effect of the stress state.