PREDOMINANT PARANETERS
It has been demonstrated that the deformation characteristics were affected by the shear history under constant p' . It seems that the effects of the shear history under constant p' are demonstrated as the difference in the elastic limit progress. In this model, the predominant parameters through which the effect of the shear history is explained in a unified manner are selected and moreover their effectiveness is demonstrated.
The difference in stress conditions between the shear history and the shear is important when explaining the effect of the shear history. The following three parameters are defined as predominant:
1. The difference in α between the shear history and the shear (|αh - αs |), which is referred to as α'.
2. The difference in b between the shear history and the shear (|bh - bs |), which is referred to as b' .
3. The yield ratio, which is referred to as ry , and calculated as follows.
Relative magnitude of the intermediate principal stress, b :
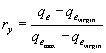
where, qemax is q at a yield point when α and b are both coincident between the shear history and the shear(this means α'= 0 and b' = 0), qevirgin is q at a yield point on virgin shear and qe is q at a yield point in certain test conditions.
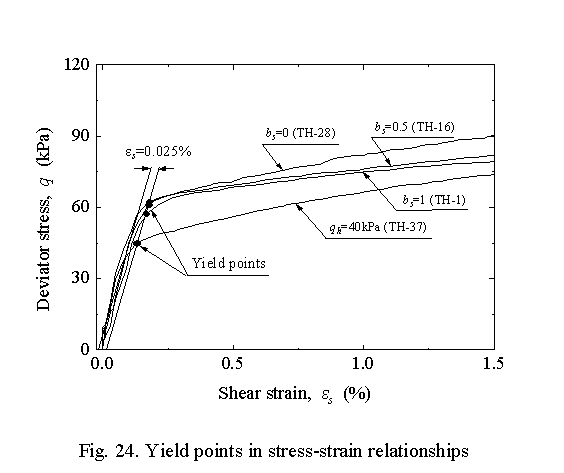
Figure 24 demonstrates the yield points for a certain series of tests. Tests TH-1, TH-16 and TH-28 are sheared at b = 0, 0.5 and 1, respectively. The inclines of the linear parts in the initial stages of the stress-strain relationships are almost the same. This means that the elastic modulus is independent of bs during the shear. The yield points are shown as the black dots at which a straight line crosses the stress-strain curve in this figure. This straight line is parallel to the linear parts of the stress-strain curve with an offset of εs = 0.025% from the linear part to take into consideration the effect of the transitional region between the elastic and elasto-plastic regions. The qemax of the tests subjected to qh = 60kPa is approximately 60kPa in this method.
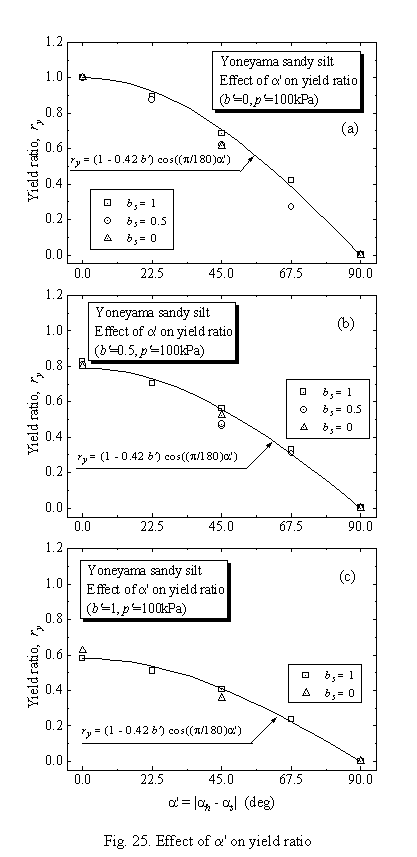
Figure 25 shows the relationships between the yield ratio and α' at various values of b' . The yield ratio decreases, when α' increases. The fitting curve of the relationships between ry and α' can be approximately calculated for the sinusoidal function for each value of b' .
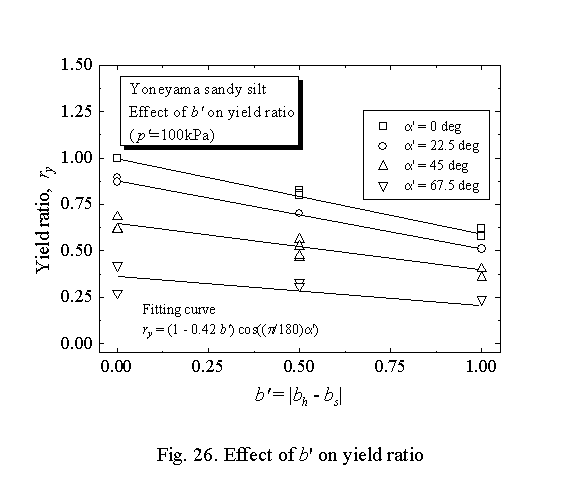
Figure 26 shows the relationships between the yield ratio and b' at various values of α'. For each α', the yield ratio decreases linearly with increasing b' . It is shown that when α' is larger, the inclination of the linear relationship becomes shallower.
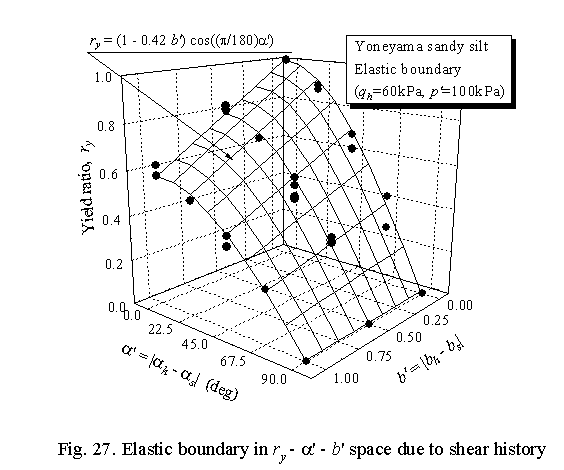
Figure 27 shows the relationships between the yield ratio, α' and b' in three-dimensional space. The relationship between ry , α' and b' can be approximately calculated as follows by considering the two dimensional relationships shown in Figs. 25 and 26.

In this equation, the unit of α' is degrees.
This equation indicates the boundary at which the elastic and the plastic regions are divided in the ry - α' - b' space.
The contour lines of ry on the α' - b' plane are shown in Fig. 28. The contour lines were calculated in Eq. (13), which demonstrates the approximate surface of the elastic boundary. It is clear that when α'and b' increase, ry decreases.
It has been demonstrated that the shear direction and the stress conditions are very important when describing the induced anisotropy of a cohesive soil. Moreover, the analytical method using α'and b' has been demonstrated to be effective in this research. These results might not be directly applicable to real problems because only the effect of pure shear history (constant p' ) is being examined. However, it is expected that the results will constitute the fundamental data needed to conduct constitutive relations or analytical models relating to the induced anisotropy.
RETURN